
Synthetic aperture radar (SAR) uses microwaves to image the Earth and other planetary bodies. Unlike most optical instruments, SAR is an active sensor that transmits pulses toward the surface and then receives the backscattered echoes. Therefore, SAR does not require solar illumination and can acquire images day or night. Moreover, microwaves can penetrate clouds, enabling SAR to operate under all weather conditions. A significant advantage of remote sensing with SAR is that the entire process, from the underlying physical principles to data processing techniques, is highly quantitative, enabling the retrieval of physical parameters with high precision.
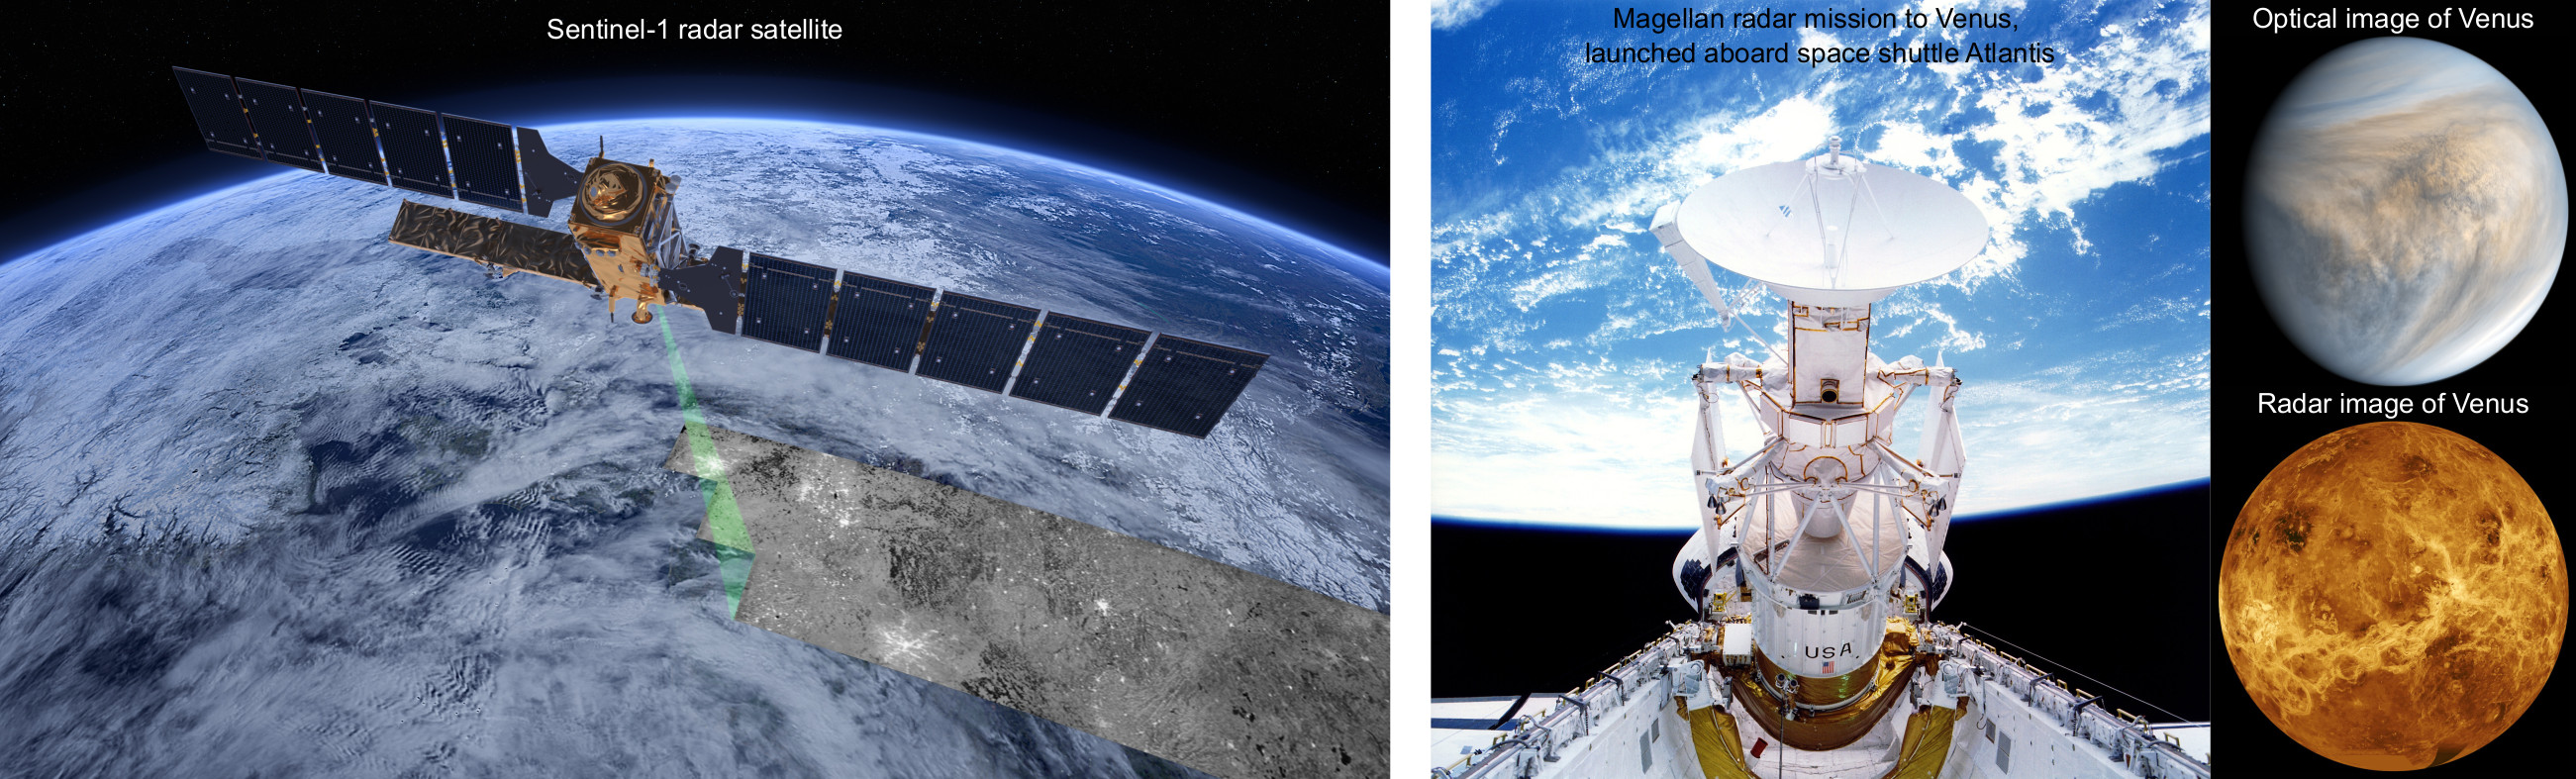
The development of synthetic aperture radar interferometry (InSAR) over the last few decades has further enabled SAR to measure the Earth’s surface in the third dimension, providing information on topography and surface deformation. InSAR measures surface deformation using the phase of radar waves, whose wavelengths range from a few to several tens of centimeters, and thus can achieve the amazing centimeter- to millimeter-level precision. Coincidentally, many deformations on the Earth’s surface are comparable in magnitude to radar wavelengths (yes, surface deformation occurs almost everywhere on Earth. You just cannot see it in most cases, but InSAR can). Therefore, InSAR is widely used in engineering and scientific applications and has even revolutionized research in related fields. Driven by their unique capabilities and a growing range of applications, SAR and InSAR are expanding beyond academia, with an increasing number of companies around the world commercializing these technologies. Analysts estimated the global SAR market at roughly $4 billion in 2021 and projected it to nearly double over the following five years (Rosen, 2021, Science).
Radar Signal and Image Processing
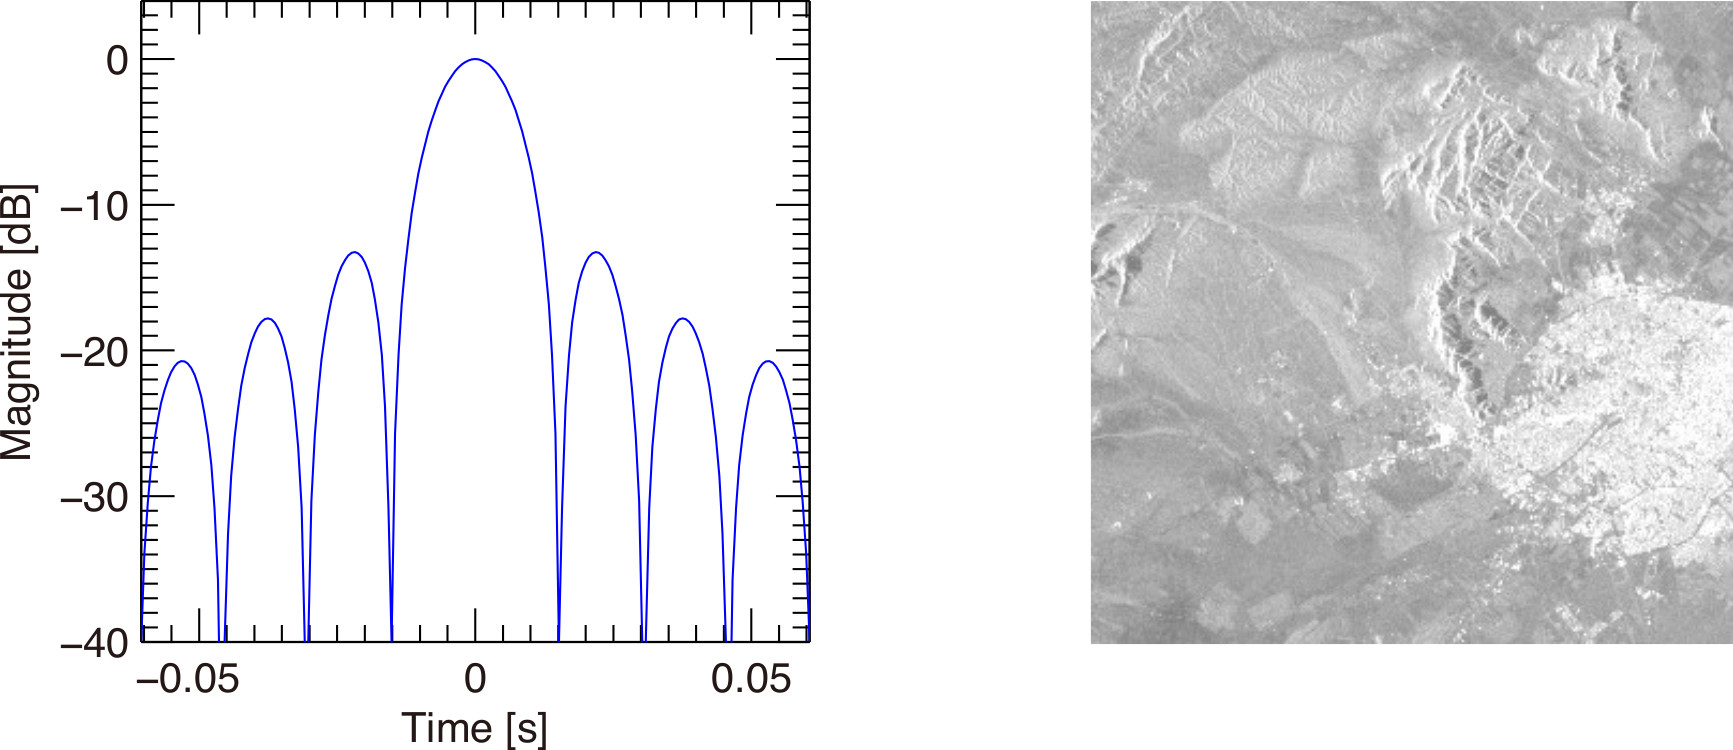
Radar signal and image processing draws on theories from statistics, signal processing, electromagnetic scattering, and geodesy. A typical example is SAR focusing. The original data acquired by SAR are called raw data, which look much like pure noise if displayed as an image. Through signal processing techniques, or focusing, an image can be formed. Further processing, such as denoising, is thus performed in the image domain for numerous applications. One of our group’s research focuses is on the processing of data acquired in advanced modes, such as spotlight, ScanSAR, TOPS and SweepSAR, which requires more sophisticated signal processing algorithms (e.g., Liang et al., 2017, IEEE TGRS).
Synthetic Aperture Radar Interferometry (InSAR)
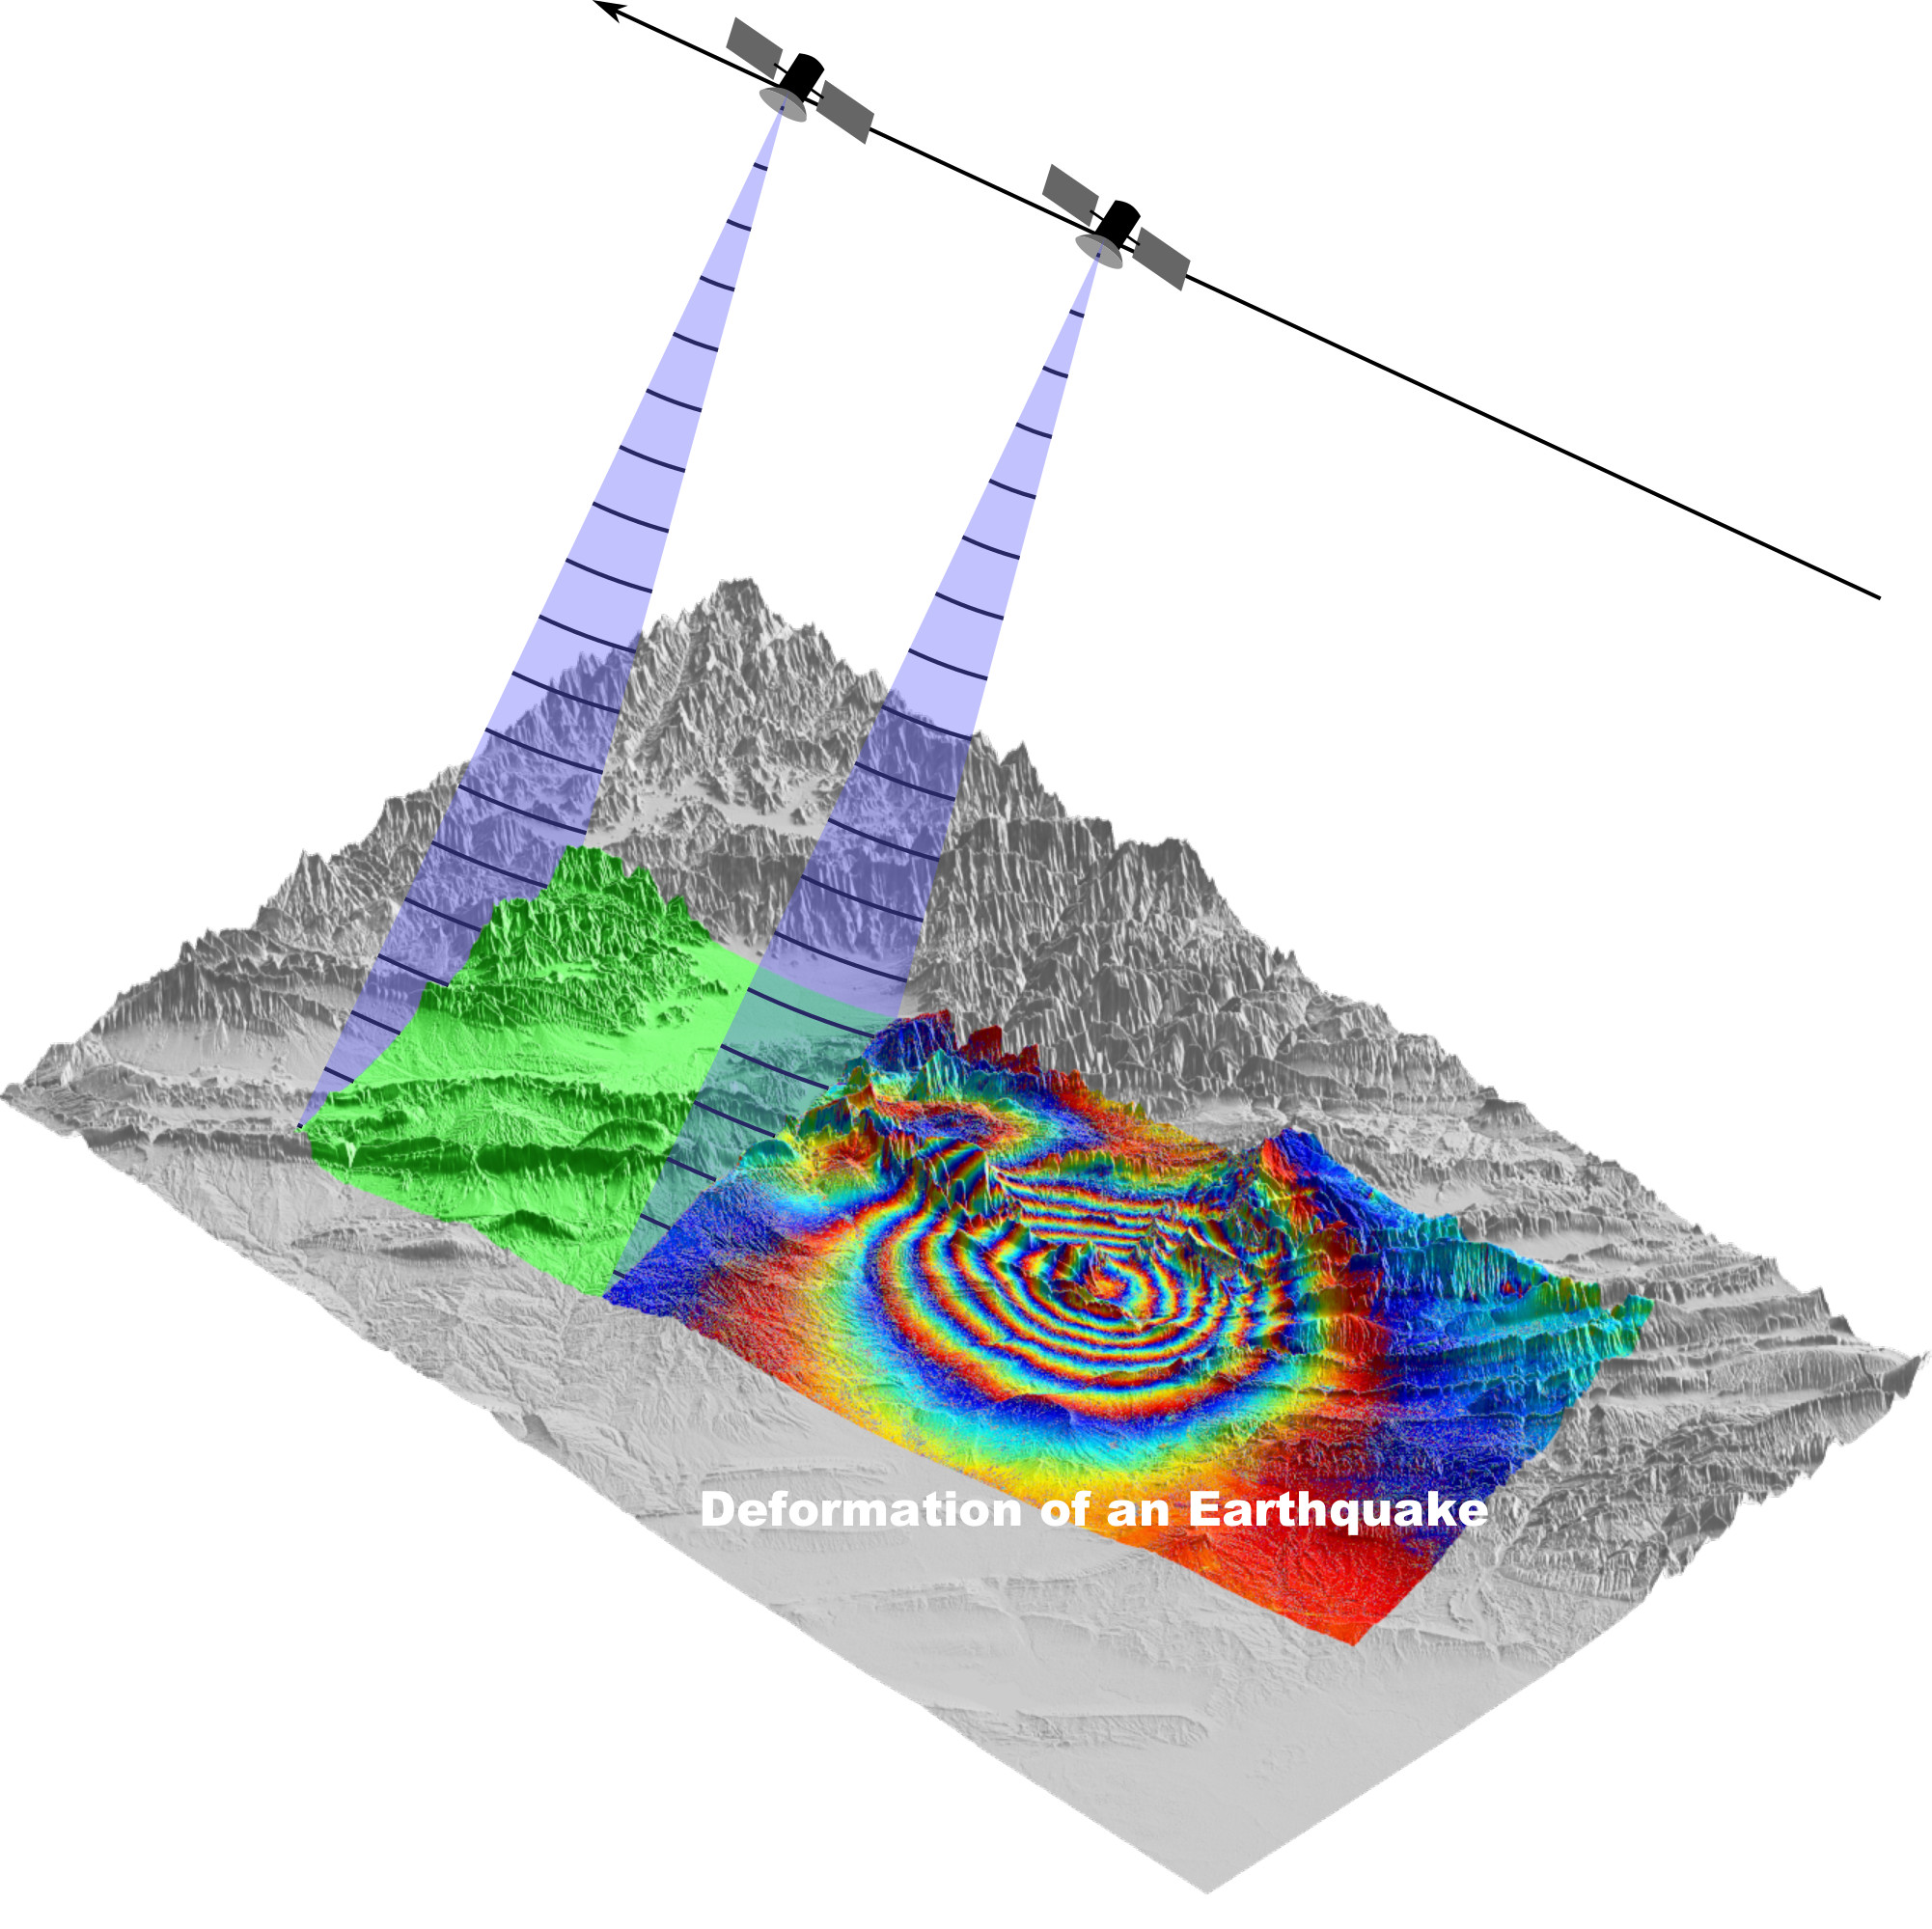
A SAR image is a complex image with both magnitude and phase. By comparing the phases of two radar images, InSAR can measure topography or deformation on the Earth’s surface. The cool thing about satellite InSAR is that it measures deformation on the ground with centimeter or even millimeter precision at an altitude of about 800 km above the Earth’s surface. Furthermore, the measurement is an image, which is like deploying millions of Global Navigation Satellite System (GNSS) stations on the ground to monitor surface deformations. By processing many InSAR images with time series analysis techniques, we can further track the temporal evolution of surface deformation, which has numerous applications.
InSAR involves a number of processing steps and still has challenges or even bottlenecks. The algorithms are continuously evolving. With an ever-growing number of satellite SAR missions and advanced imaging capabilities, the amount of SAR data is exploding - SAR is also entering the big data era. This brings new challenges and opportunities, especially for InSAR time series analysis, and requires efficient processing techniques.
Our group primarily works on the theory and technical development of InSAR (e.g. Liang and Fielding, 2017a, IEEE TGRS, Liang and Fielding, 2017b, IEEE TGRS), with a particular focus on L-band as we enter the golden age of L-band satellite SAR missions. We seek to understand the physical processes, signals, and errors that shape InSAR measurements through mathematical modeling and to translate this understanding into improved InSAR techniques for geodetic and geophysical applications. In the long run, one of our goals is to enable the measurement of global tectonic motions solely through InSAR, without relying on external constraints such as GNSS.
SAR and InSAR Signal and Error Analysis and Corrections
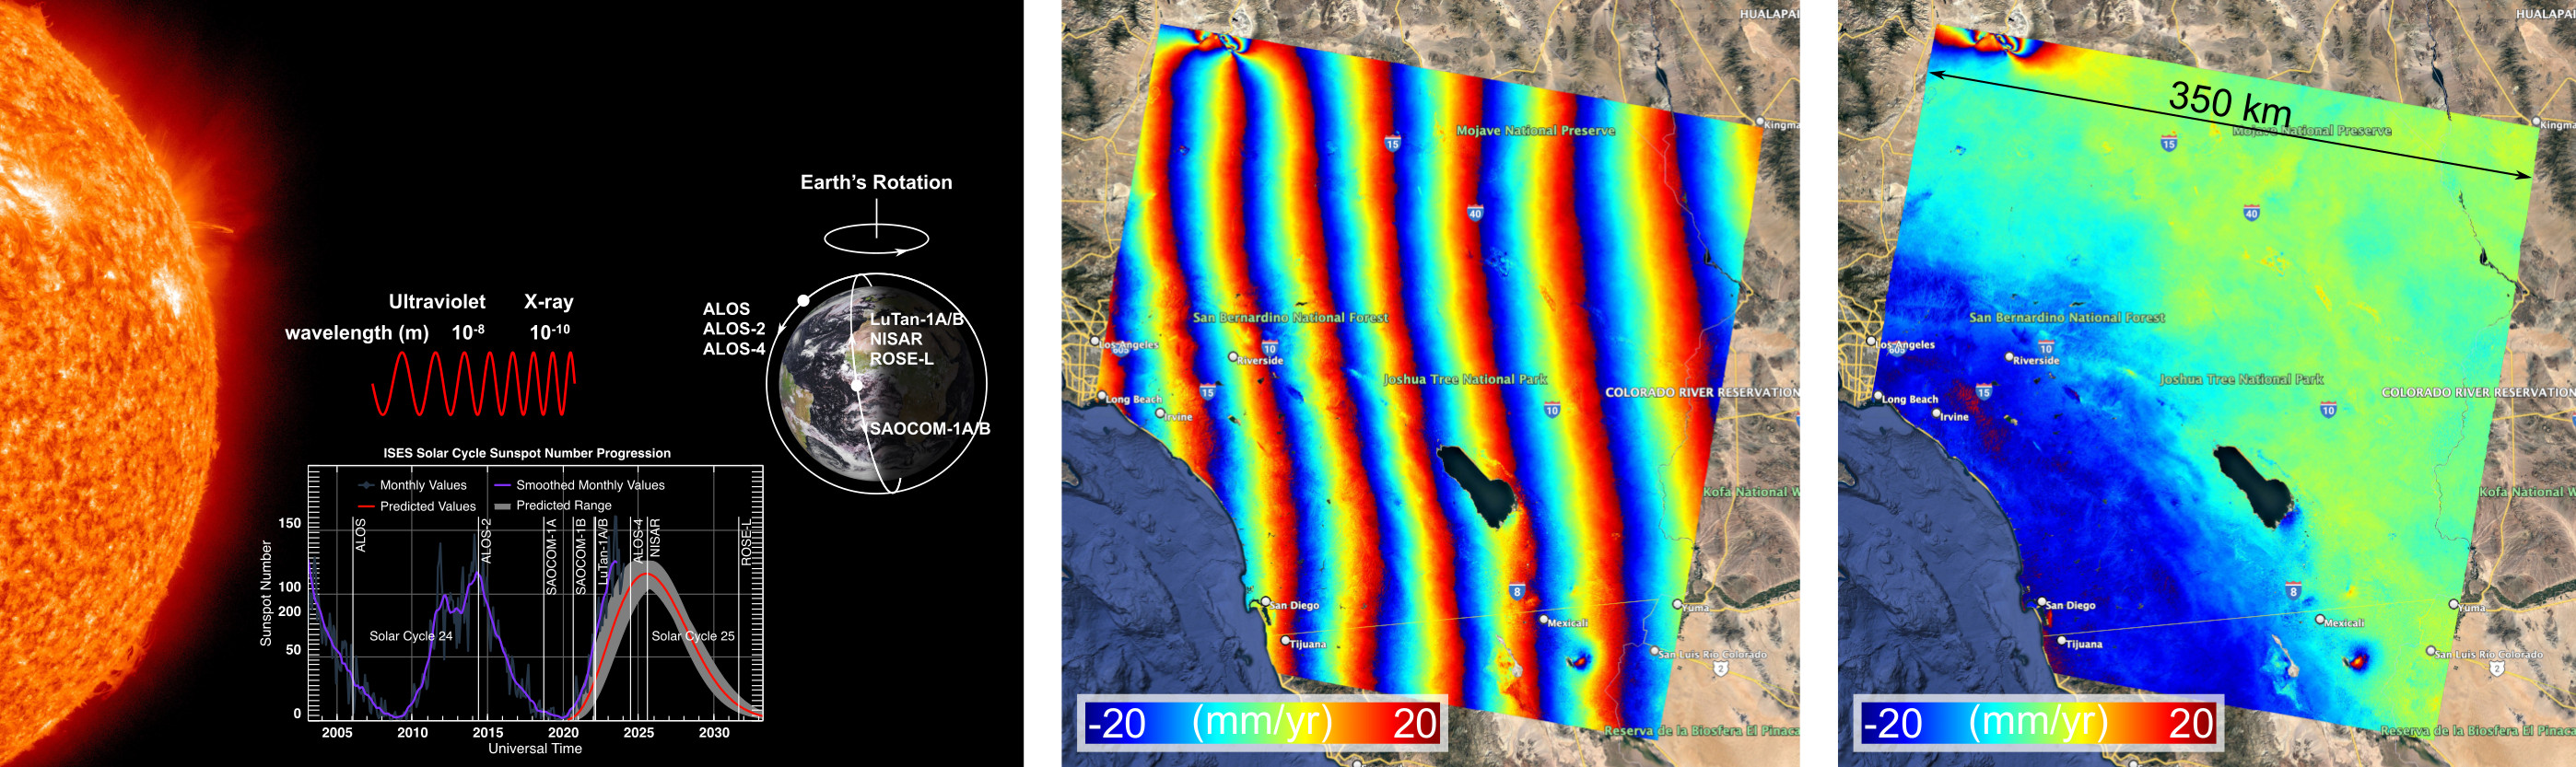
SAR and InSAR measurements comprise not only desired signals, but also other signals and errors. The most significant one is atmospheric refractions, arising primarily from the troposphere and ionosphere. The troposphere is the lowest layer of the Earth’s atmosphere, while the ionosphere can extend from 50 km to 1000 km above the Earth’s surface. Our group has extensively studied the ionospheric effects on SAR and InSAR and developed a number of techniques to correct for these effects.
Deformations measured by InSAR also include those induced by plate motion, solid Earth tide, ocean tide loading, pole tide, ocean pole tide loading, atmospheric tide loading, and non-tidal loading. Moreover, InSAR measurements also contain signals induced by surface and near-surface physical processes, mostly associated with the dynamics of water. Finally, InSAR measurements might be degraded or even corrupted by errors and noise.
Our group studies all sources of errors along with methods for correcting them to improve the accuracy and precision of InSAR measurements (e.g., Liang and Fielding, 2017, IEEE TGRS, Liang et al., 2019, IEEE TGRS) and, in particular, to enable independent InSAR measurements, without relying on external constraints such as GNSS. In the meantime, we can advance the science in related fields (e.g., atmospheric sciences) through synthetic aperture radar.
SAR and InSAR Applications
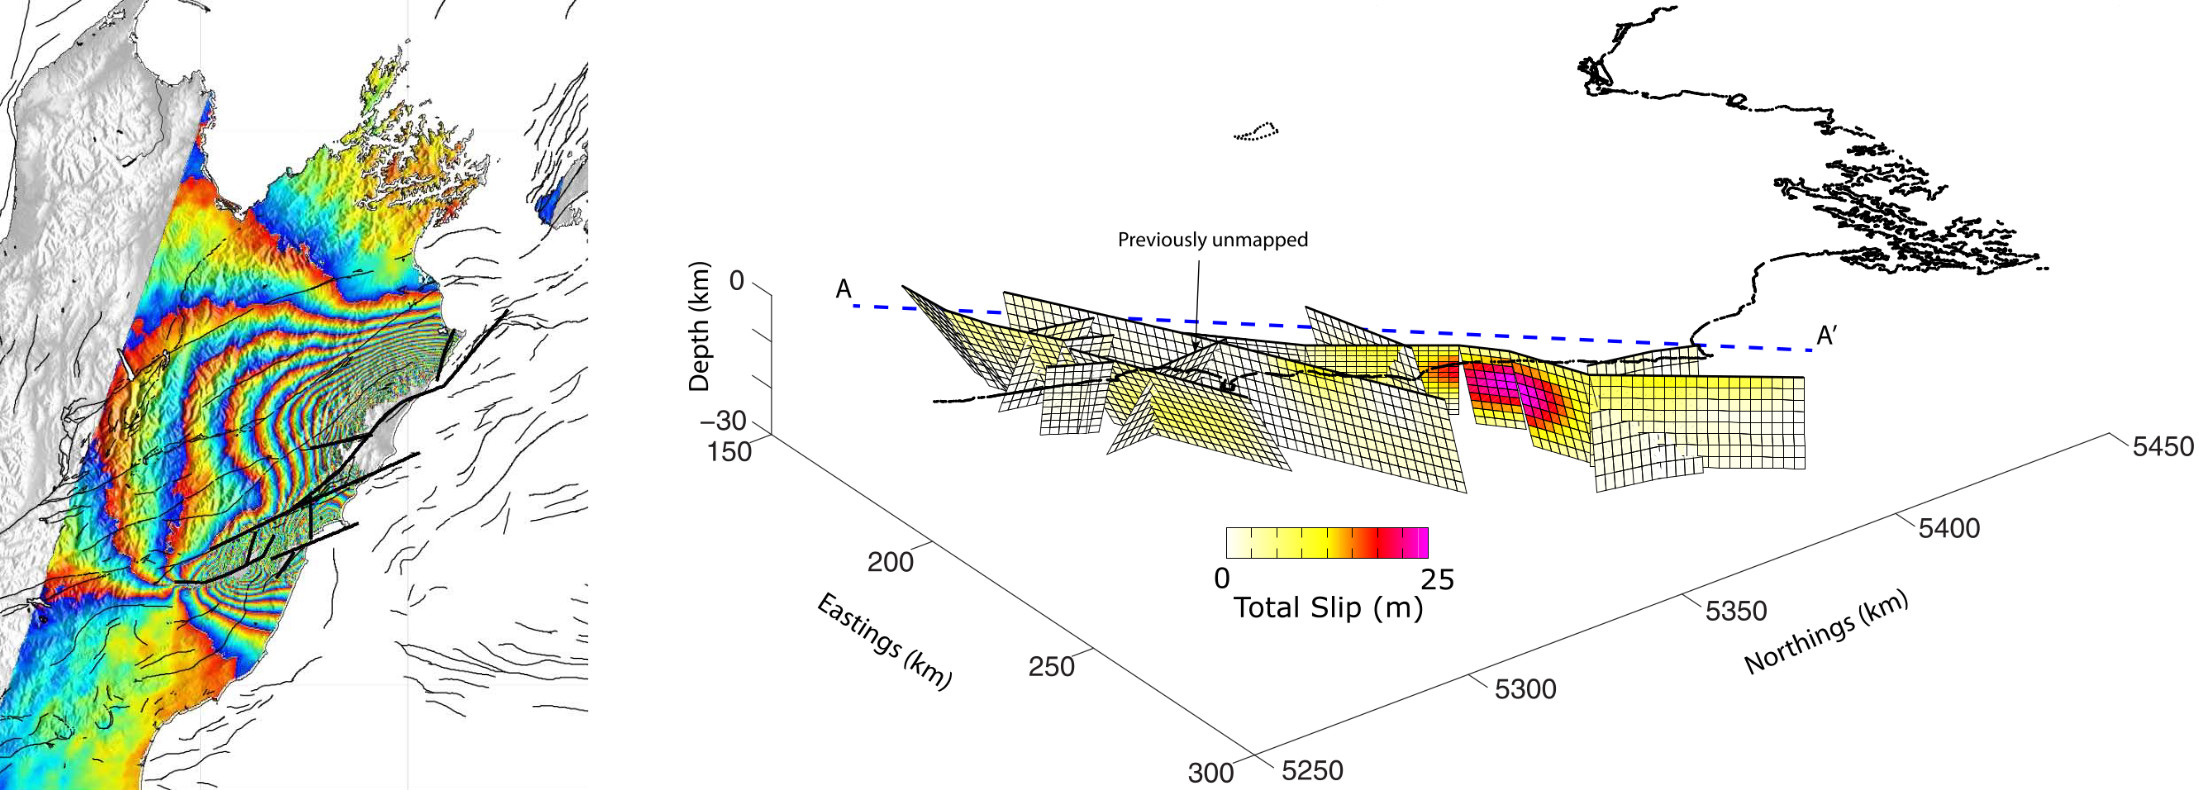
The unique capabilities of SAR and InSAR make them widely used in science and engineering. In particular, InSAR has been used to study earthquakes, tectonics, glaciers, volcanoes, landslides, hydrology, etc. InSAR has also been used in a number of engineering fields, such as the monitoring of critical infrastructure (e.g., buildings, bridges, dams, tunnels, subways, and railways), city subsidence, land subsidence due to oil and water pumping, and mining. Another important use of SAR and InSAR is the study and monitoring of natural hazards, which is particularly valuable in regions such as southern China, where geohazards can occur frequently, but cloudy or rainy conditions often make optical remote sensing difficult. New applications are also emerging in other fields. Our group has been collaborating with researchers at major universities, such as UC Berkeley, UCLA, and Caltech, to apply InSAR to the study of significant problems in geophysics (e.g. Hamling et al., 2017, Science).
Research Funding and Projects
- 国家海外高层次人才计划项目(青年), PI
- 国家自然科学基金面上项目 - 复杂困难地区大范围L波段InSAR时序分析技术研究, PI
- 南方科技大学委托项目, PI
- ALOS-4 Calibration/Validation and Science Team (CVST) project (2025–2028), Japan Aerospace Exploration Agency (JAXA), Japan, PI
- ALOS-4 Calibration/Validation and Science Team (CVST) project (2022–2025), Japan Aerospace Exploration Agency (JAXA), Japan, PI
- New Techniques for Monitoring Carbon Stock and Flux in Southeast Asia using Spaceborne SAR and LiDAR Observations, Space Technology Development Programme, Singapore, International Collaborator
- Integrating Volcano and Earthquake Science and Technology (InVEST) in Southeast Asia, Ministry of Education, Singapore, International Collaborator
Prior to joining Peking University (Selected)
- NISAR Mission Science Team project, awarded 2018, Co-I
- NASA Earth Science Applications: Disaster Risk Reduction and Response, awarded 2018, Co-I
- NASA Earth Surface and Interior projects, awarded 2015, 2016, 2017, Co-I
- NISAR Mission Science Definition Team project, awarded 2015, Co-I